

Introduction
If you have used Excel spreadsheets or CSV files in the past then you are already aware of pivot tables. Pivot tables are an important tool in data analysis and Pandas also provides the same feature with the pivot_table() method.
But, I have seen that many newcomers get confused with pivot_table syntax, how it works and finally they avoid using it altogether. It’s so simple that once you know its syntax and how it works you can use the Pandas pivot table feature like a pro.
In this beginner-friendly article, I will explain how pivot table works in Pandas with examples.
What is a Pivot table?
This definition from Microsoft tells us how important the pivot tables are as part of the data analysis. All major programming languages such as Python, R, Go lang, Java, etc. provides function/methods to create pivot tables.
"A PivotTable is a powerful tool to calculate, summarize, and analyze data that lets you see comparisons, patterns, and trends in your data."
Pandas pivot_table
In Python, you can quickly create pivot tables using the Pandas pivot_table() method. Let’s go over the syntax and its meaning. And then we will understand how to create pivot tables with examples.
Syntax
					pandas.pivot_table(data,
                   values=None,
                   index=None,
                   columns=None,
                   aggfunc='mean',
                   fill_value=None,
                   margins=False,
                   dropna=True,
                   margins_name='All',
                   observed=False,
                   sort=True
                   )
Don’t be frightened looking at the parameters. Just read through it once and as you go through the rest of the article, you will understand each and every one of these parameters.
- data — dataframe on which pivot table to be applied.
- values — the column on which aggregate functions will be applied such as mean, min, max, count, etc. The default is list of all numeric columns.
- index — one or more columns on which grouping is done.
- columns — one or more columns on which aggregate functions are broken down further.
- aggfunc — aggregate function(s) to be applied on the column name specified for values parameter. The default is ‘mean’.
- fill_value — value to replace the missing values.
- drop_na — if set to True columns whose values are all NaN are not included. The default is True.
- sort — set to True to sort the result of the pivot. The default is True.
- margins — set to True to add the sub total/grand totals.
- margins_name — the name of the sub total/grand total. The default value is ‘All’.
Set up
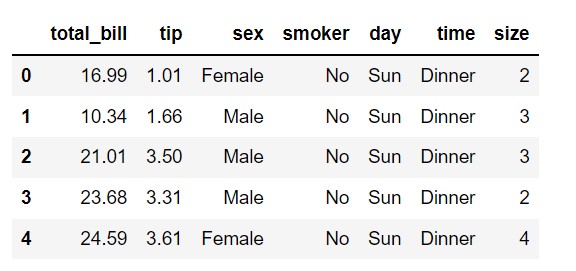
We will use the tips dataset from the seaborn library. To set up the stage, import the required libraries and load the dataset.
					>>> import pandas as pd
>>> import seaborn as sns
>>> df = sns.load_dataset('tips')
>>> df.head()
Note that you can either use pd.pivot_table() or df.pivot_table() when creating the pivot table. The only difference between the two is that when using pd.pivot_table() you need to pass the name of the dataframe as the first parameter.
Basic pivot table
To create a very basic pivot table, we need to pass at least the index parameter. Otherwise, you will run into a value error (ValueError: No group keys passed!). As the below error suggests, we need to pass the name of the column that should be considered as the grouping key to the index parameter.
					>>> pd.pivot_table(df)
ValueError: No group keys passed!
Let’s pass the index=‘sex’. As you can see, the sex column is considered the index, all the numeric columns (i.e. size, tip, and total_bill) from the dataframe are passed to the values parameters, and aggfunc=’mean’ is applied to all these numeric fields. This is the default behavior when only the index parameter is passed to pivot_table().
					pd.pivot_table(df,
               index='sex')
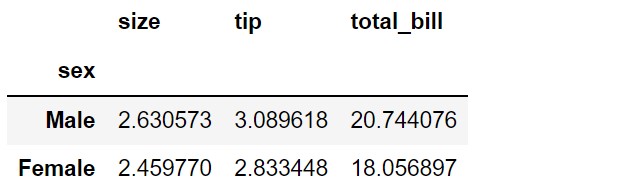
To confirm the above default behavior, let’s pass aggfunc, and values parameters explicitly. We can exact the same result as above.
					pd.pivot_table(df,
               index='sex',
               aggfunc='mean',
               values=['size', 'tip', 'total_bill'])
Specify one or more columns as an index
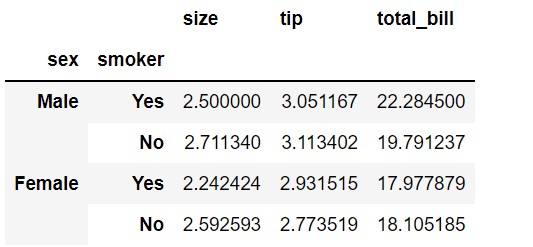
In the previous example, we used only the ‘sex’ column as the index. We can pass one or more columns to the index parameter. Let’s consider both ‘sex’, and ‘smoker’ as the index. The result will be similar to the above but with an additional index ‘smoker’.
					pd.pivot_table(df,
               index=['sex', 'smoker'])
Specify one or more columns for aggregation as values
In the previous examples, we didn’t pass anything to the values parameter. So, the default behavior was to consider all the numeric fields as values. We can consider only those fields we need for the analysis.
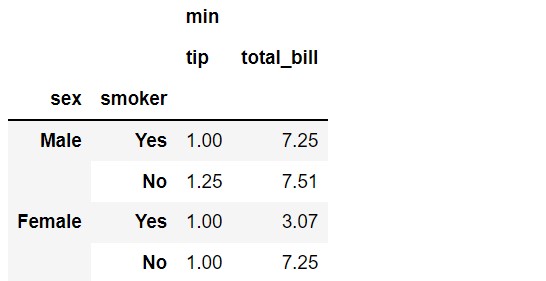
Let’s consider only the tip and total_bill as values. As you can see from the output, only tip and total_bill are considered for aggregation. In this example, we used aggfunc=[‘min’] instead of the default ‘mean’.
					pd.pivot_table(df,
               index=['sex', 'smoker'],
               values=['tip', 'total_bill'],
               aggfunc=['min'])
Specify one or more aggregate functions
So far, we used only one aggregate function (mean or min). But, it is also possible to use more than one aggregate function. Let’s see it in the code.
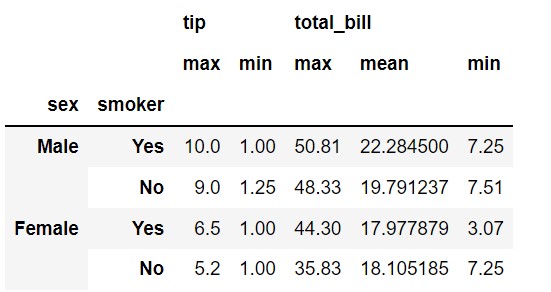
In the below example, we used min, max, mean aggregate functions on tip and total_bill. If we are dealing with more than one aggregate function, we need to pass it as key-value pairs as you see in the below examples where the key will be the column name and the value will be a list of aggregate function names.
					pd.pivot_table(df,
               index=['sex', 'smoker'],
               values=['tip', 'total_bill'],
               aggfunc={'tip': ['min', 'max'],
                        'total_bill': ['min', 'max', 'mean']})
Specify one or more columns to break down the aggregation
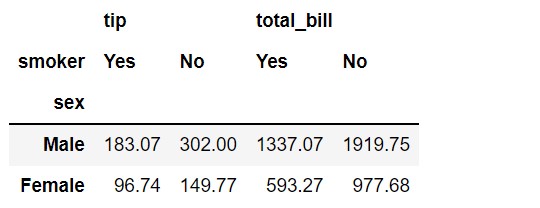
If we want the aggregate function to be broken down based on another column, you need to pass the column names to columns parameters.
In the below example, we are grouping on sex column (Male Vs. Female) with aggregate function sum applied on tip and total_bill. And then, we are breaking down this based on whether the person is a smoker or not. We achieve this we passed columns=’smoker’. Note that you can also list column names.
					pd.pivot_table(df,
               index='sex',
               values=['tip', 'total_bill'],
               aggfunc='sum',
               columns='smoker')
Add totals with margins and margins_name
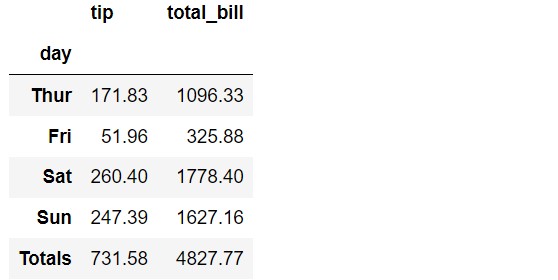
By setting margins=True, we can display the totals. And the default value of the row is ‘All’. We can change it to a more meaningful name.
In the below example, we grouped the data based on the day of the week and then took the sum of tip and total_bill. We are setting margins to True and used Totals instead of the default ‘All’.
					pd.pivot_table(df,
               index='day',
               values=['tip', 'total_bill'],
               aggfunc='sum',
               margins=True,
               margins_name='Totals')
Specify the value to fill null values
If the output of the pivot table consists of NaN (or missing values), you can fill those missing values with the value specified in the fill_value parameter.
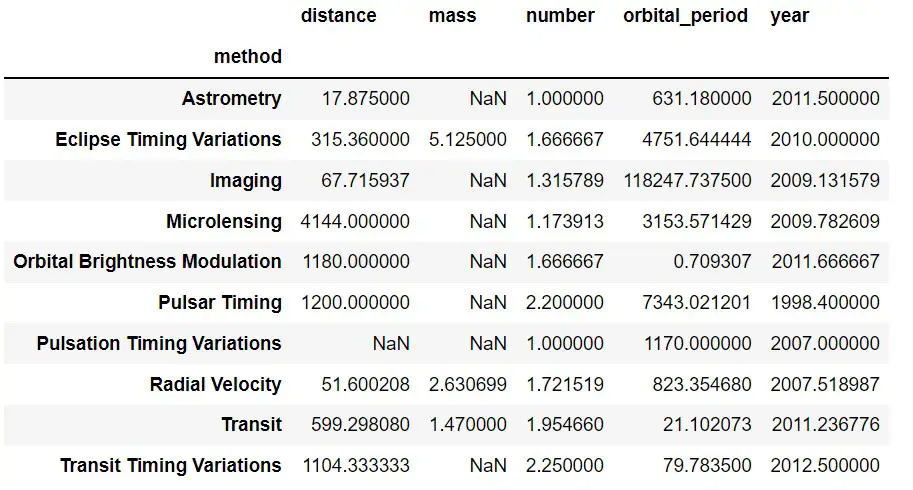
We don’t have any missing values in the tips dataset. Let’s use the planets dataset from the seaborn library. There are a lot of missing values in the result.
					df = sns.load_dataset('planets')
pd.pivot_table(df, index='method')
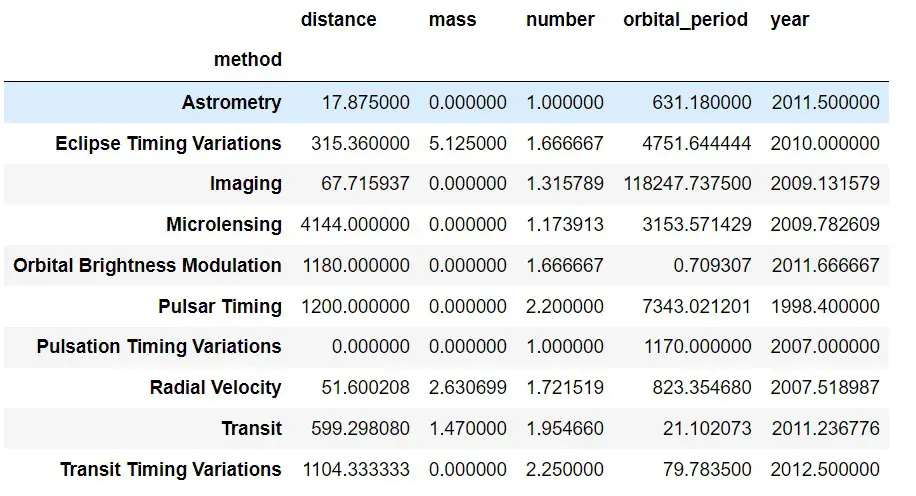
We can fill the missing values by passing the fill_value parameter. In the below example, by passing fill_value=0, we filled missing values with zero.
pd.pivot_table(df, index='method', fill_value=0)
Flag to keep/remove missing values
By setting dropna=True, the column whose values are all NaN is ignored from the pivot table. It is the default behavior.
pd.pivot_table(df, index='method', dropna=True)
Summary
In this article, we covered Pandas pivot_table() in great detail with examples. I hope you can now use Pandas pivot tables without any difficulty.
